NEWS
Vinci includes Phasors Analysis
Champaign, Illinois - January 15, 2012 - The version 2 of Vinci released by ISS (see news Dec. 3, 2011) includes the Phasors Analysis Software for the spectrofluorometers.
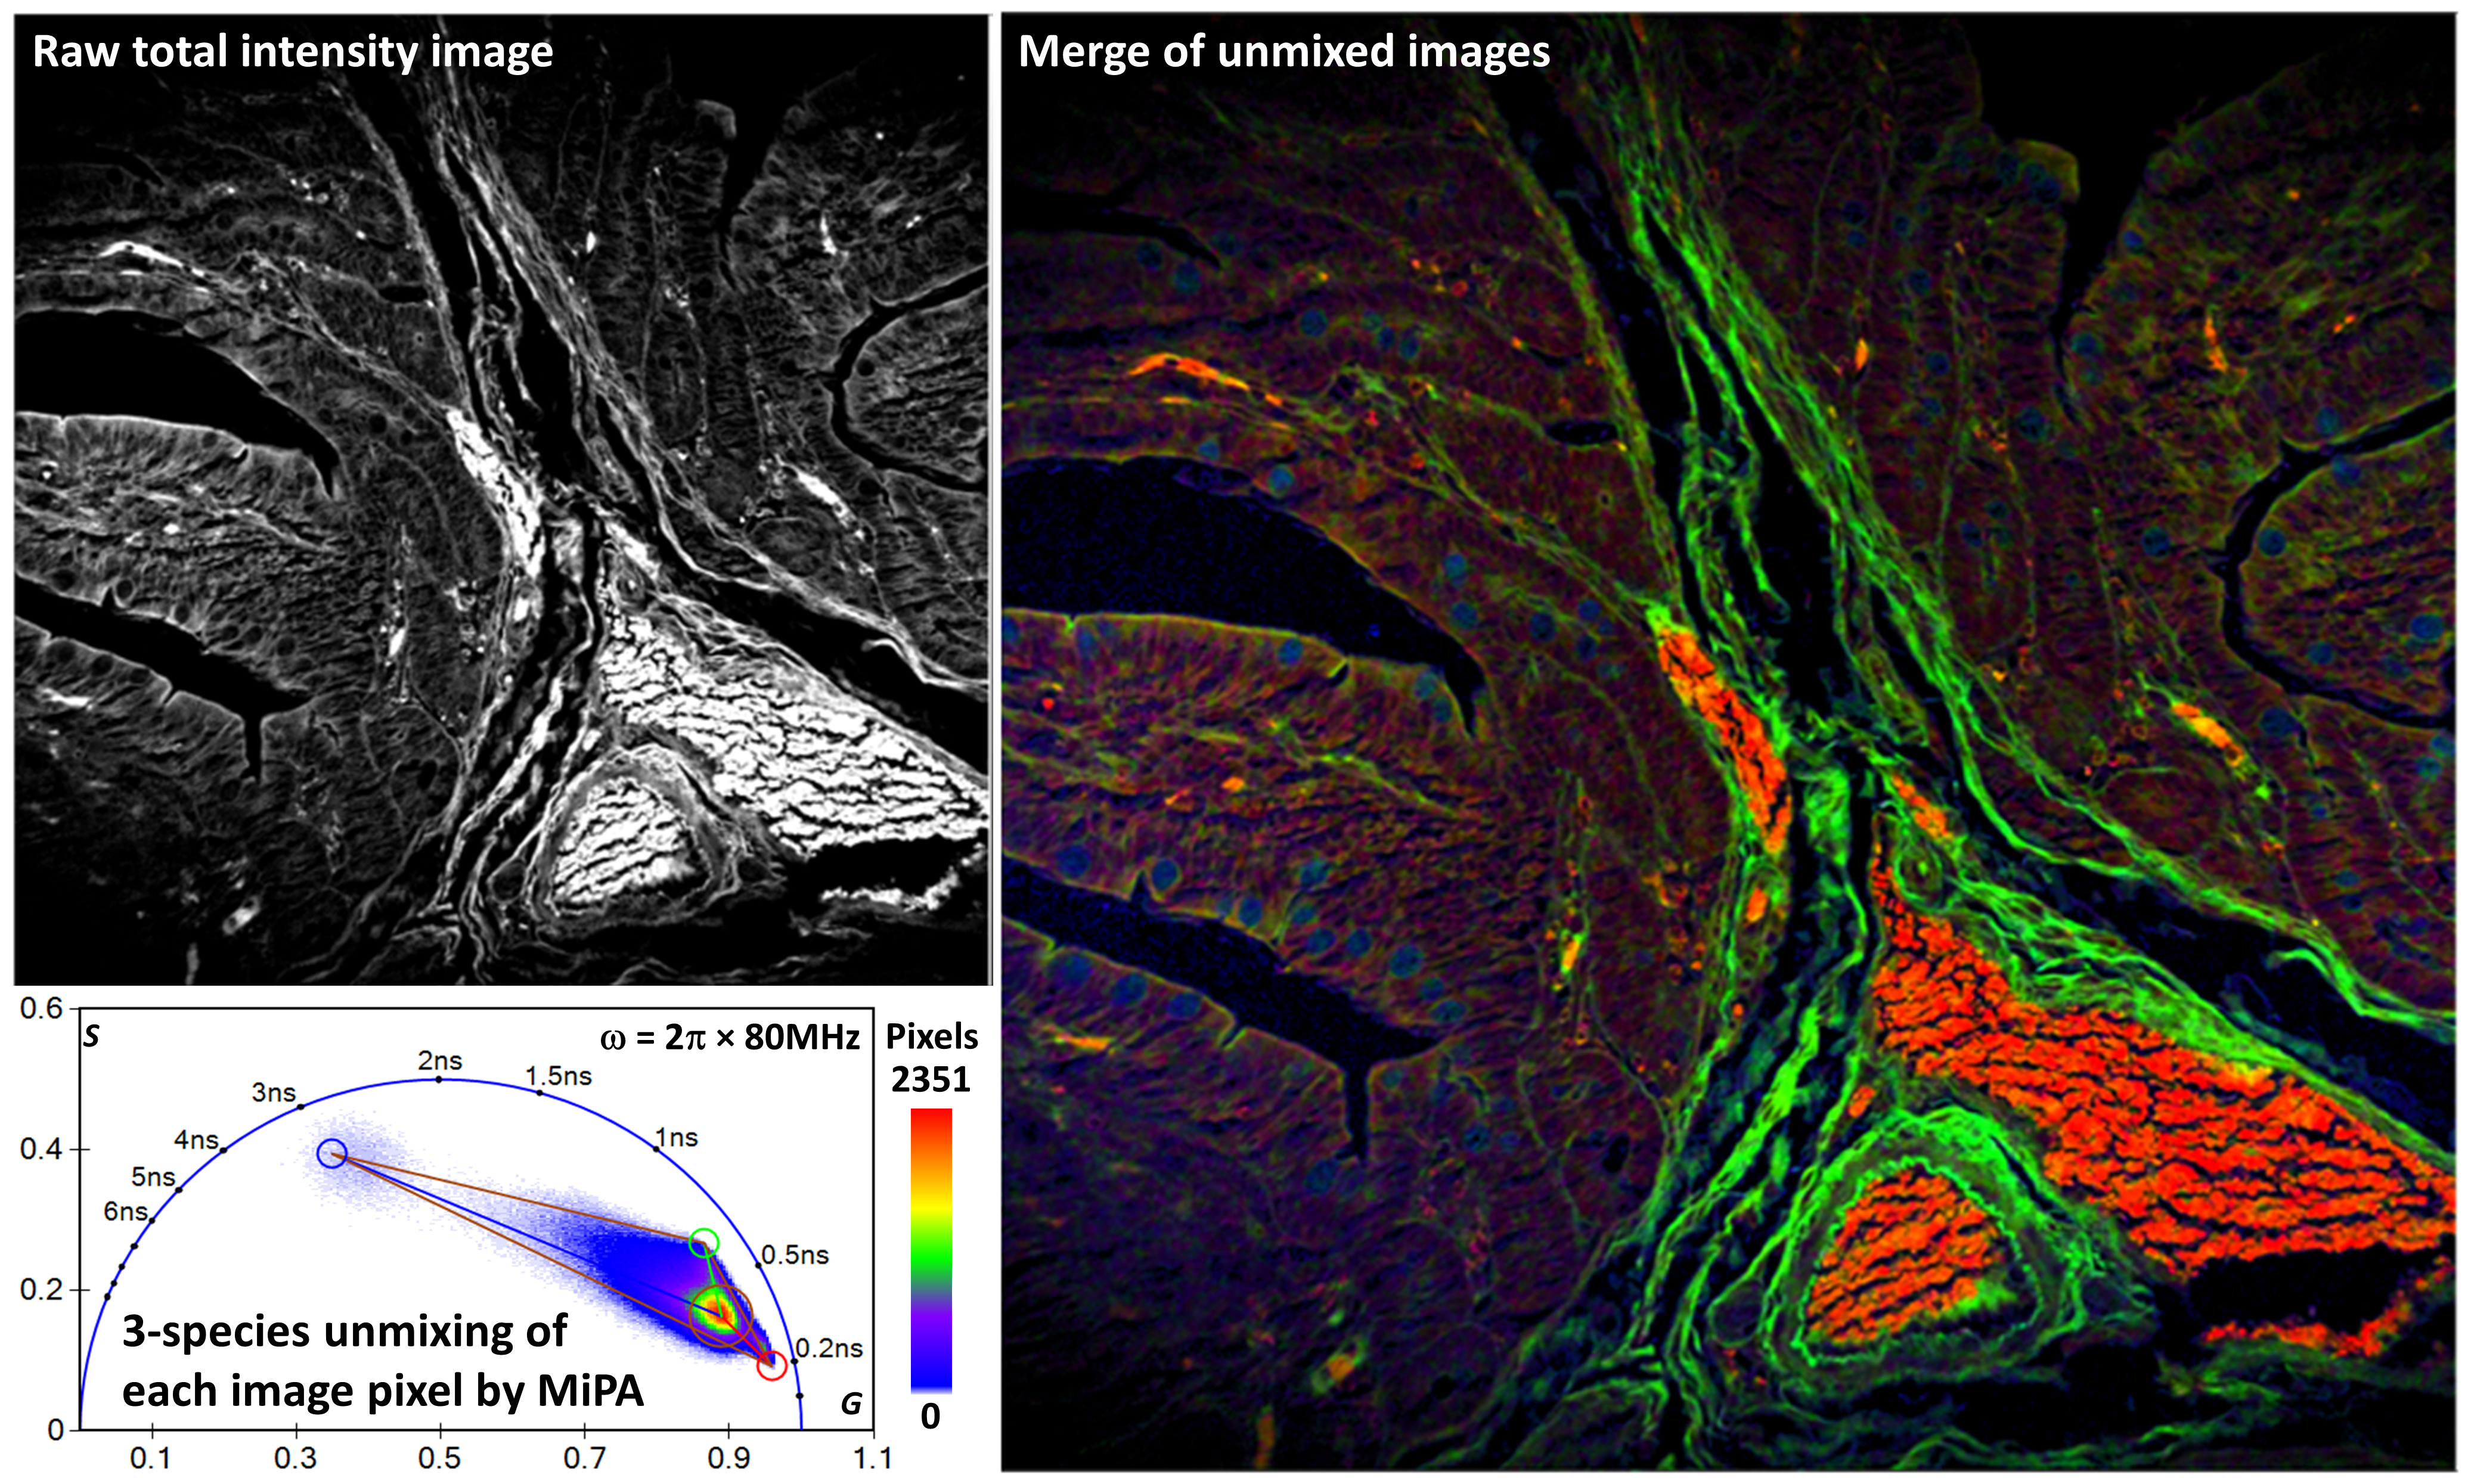
The phasor plot (or polar plot) analysis has been originally introduced in 1984 but only in the past few years researchers have been using this technique for the analysis of fluorescence lifetime imaging (FLIM) applications (for instance in VistaVision by ISS) in cells where complex heterogeneity and autofluorescence and background are displayed. The advantages of the phasors plot are innumerable: as each pixel of an image is transformed onto a point on the polar plane, the user can right away visualize the presence of decay processes which would, otherwise, require undergoing a fitting minimization routine and the application of decay models; operations that rely on some advanced level of expertise.
With the phasors plot approach, complex fluorescence decays can be analyzed even by the occasional user of the fluorescence instrumentation. These processes include solvent relaxation, Föster resonance energy transfer (FRET) or nonexponential decays due to processes such as transient quenching.
The new Vinci allows for the application of the phasor method to cuvette studies. The graphical display provides insights about the sample heterogeneity as well as the easy identification of processes such as excited states reaction and FRET that would be otherwise difficult to obtain.


