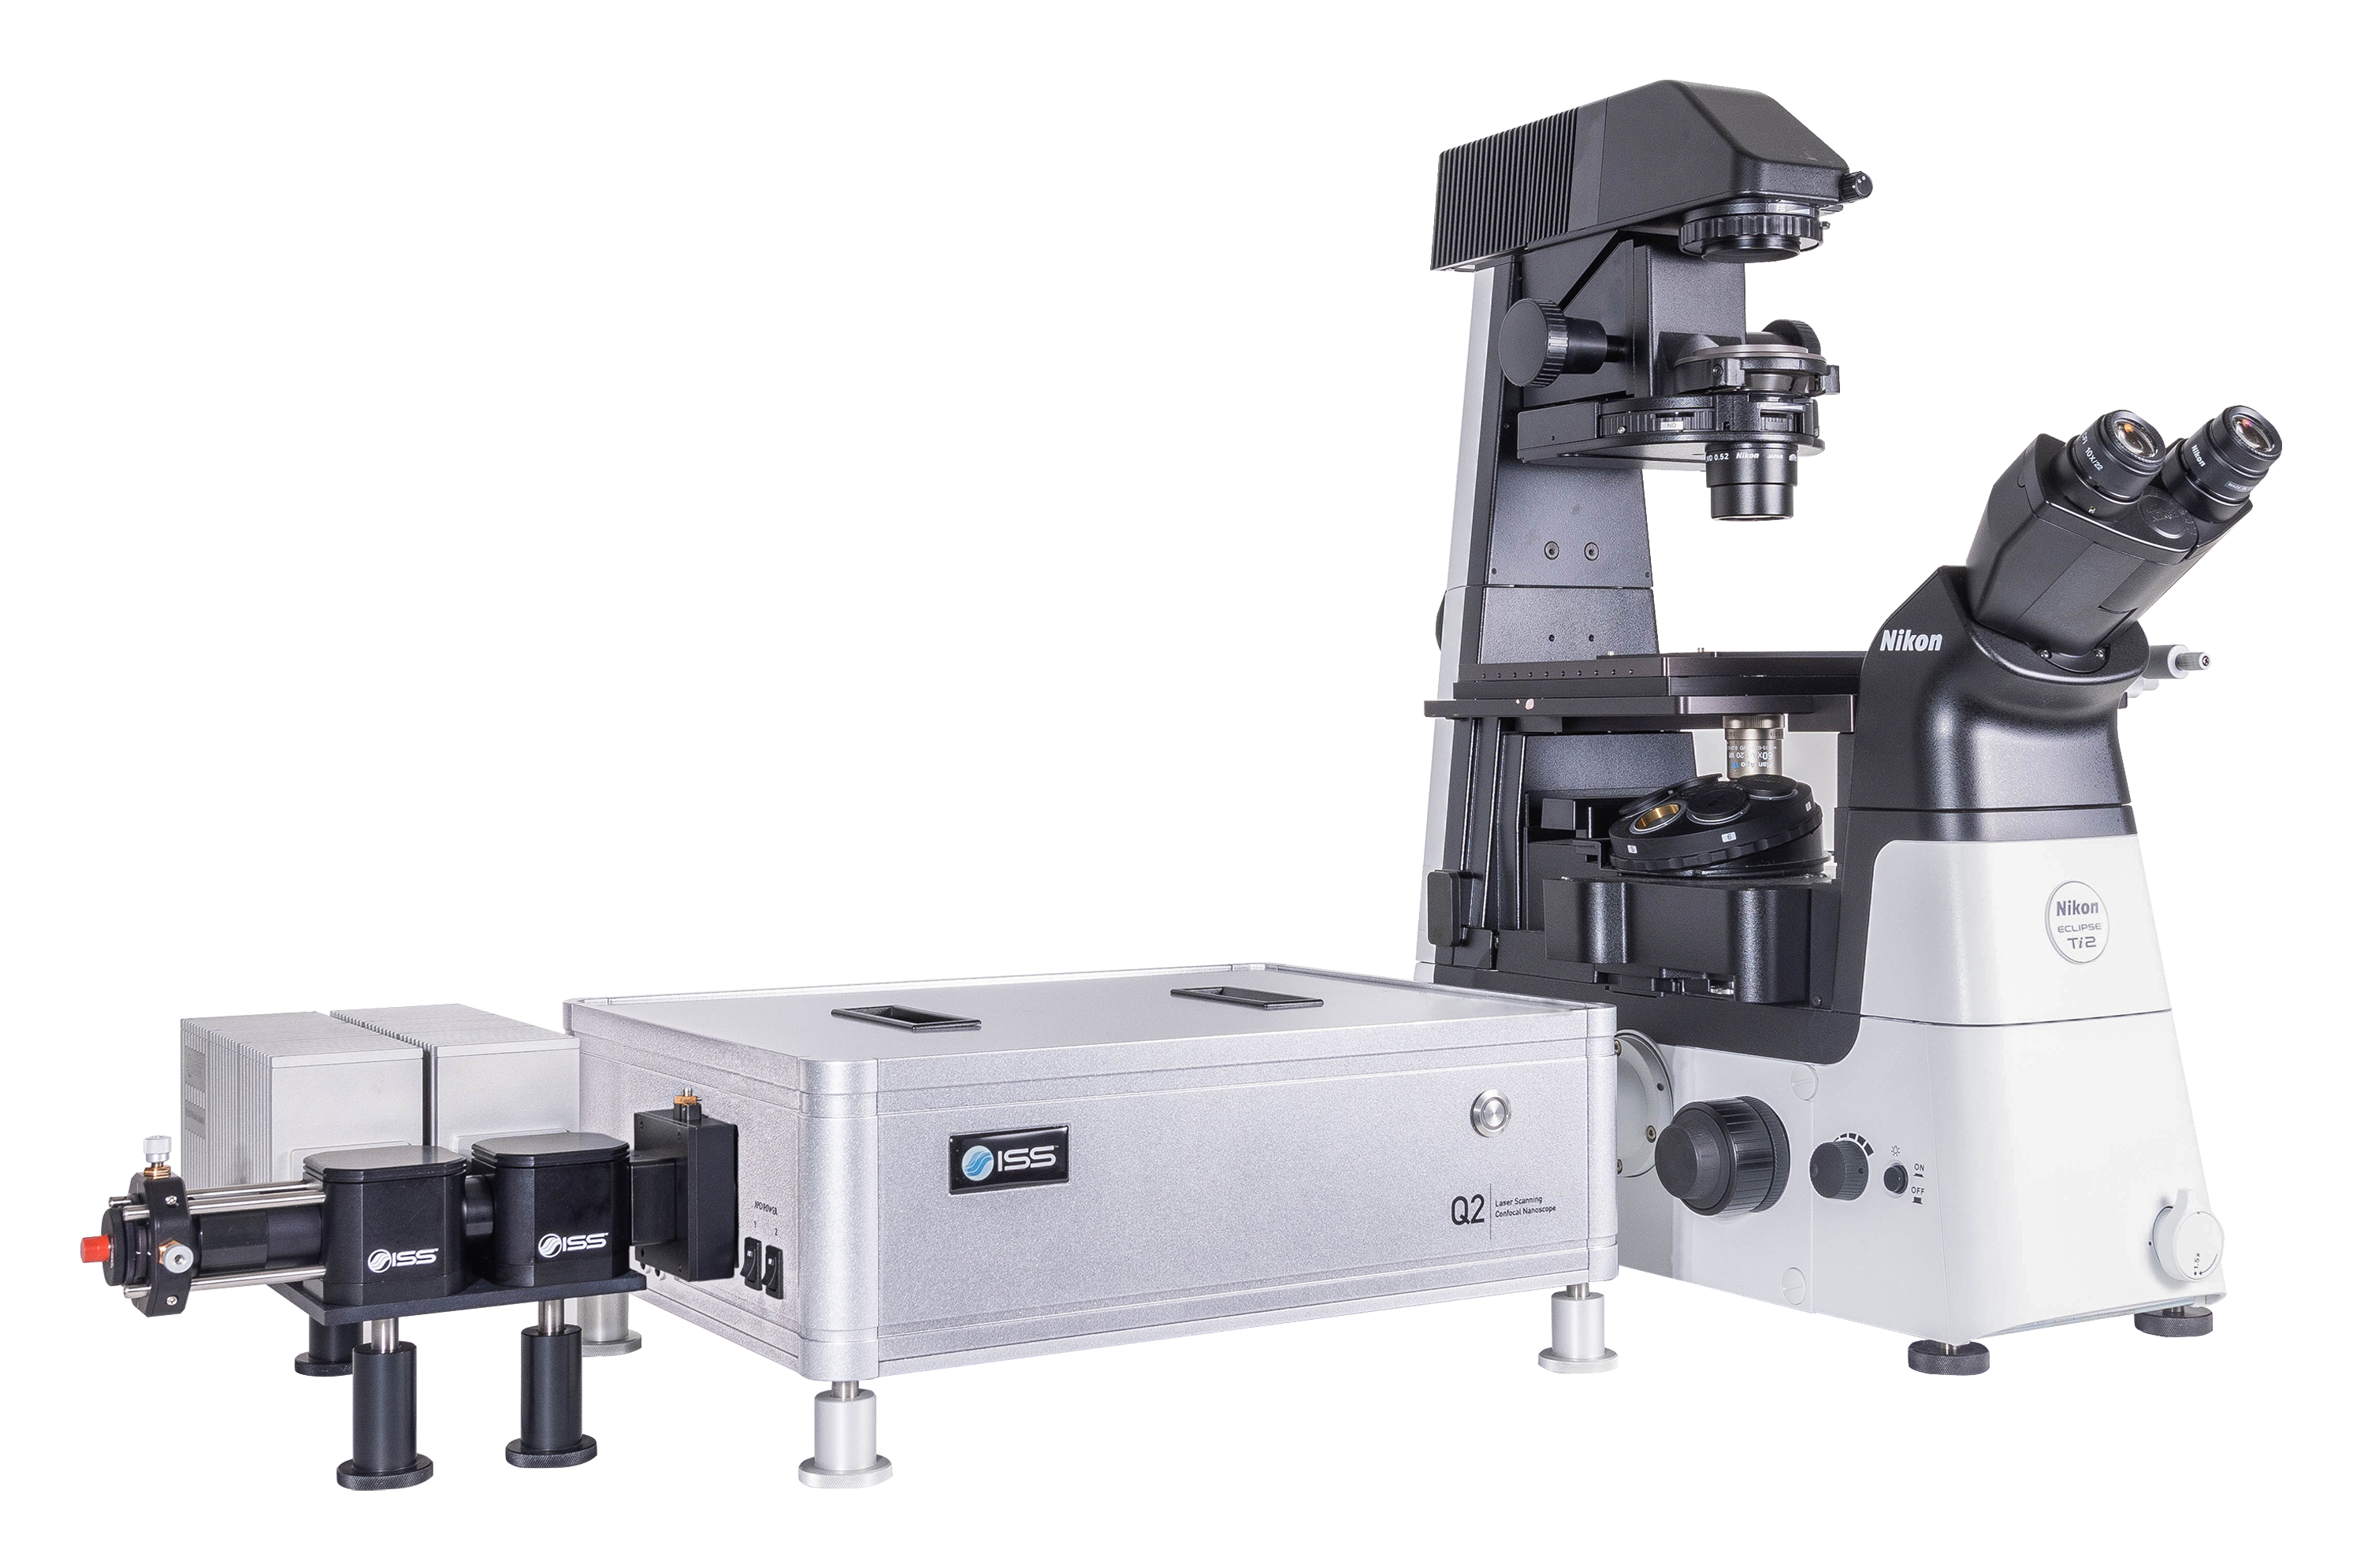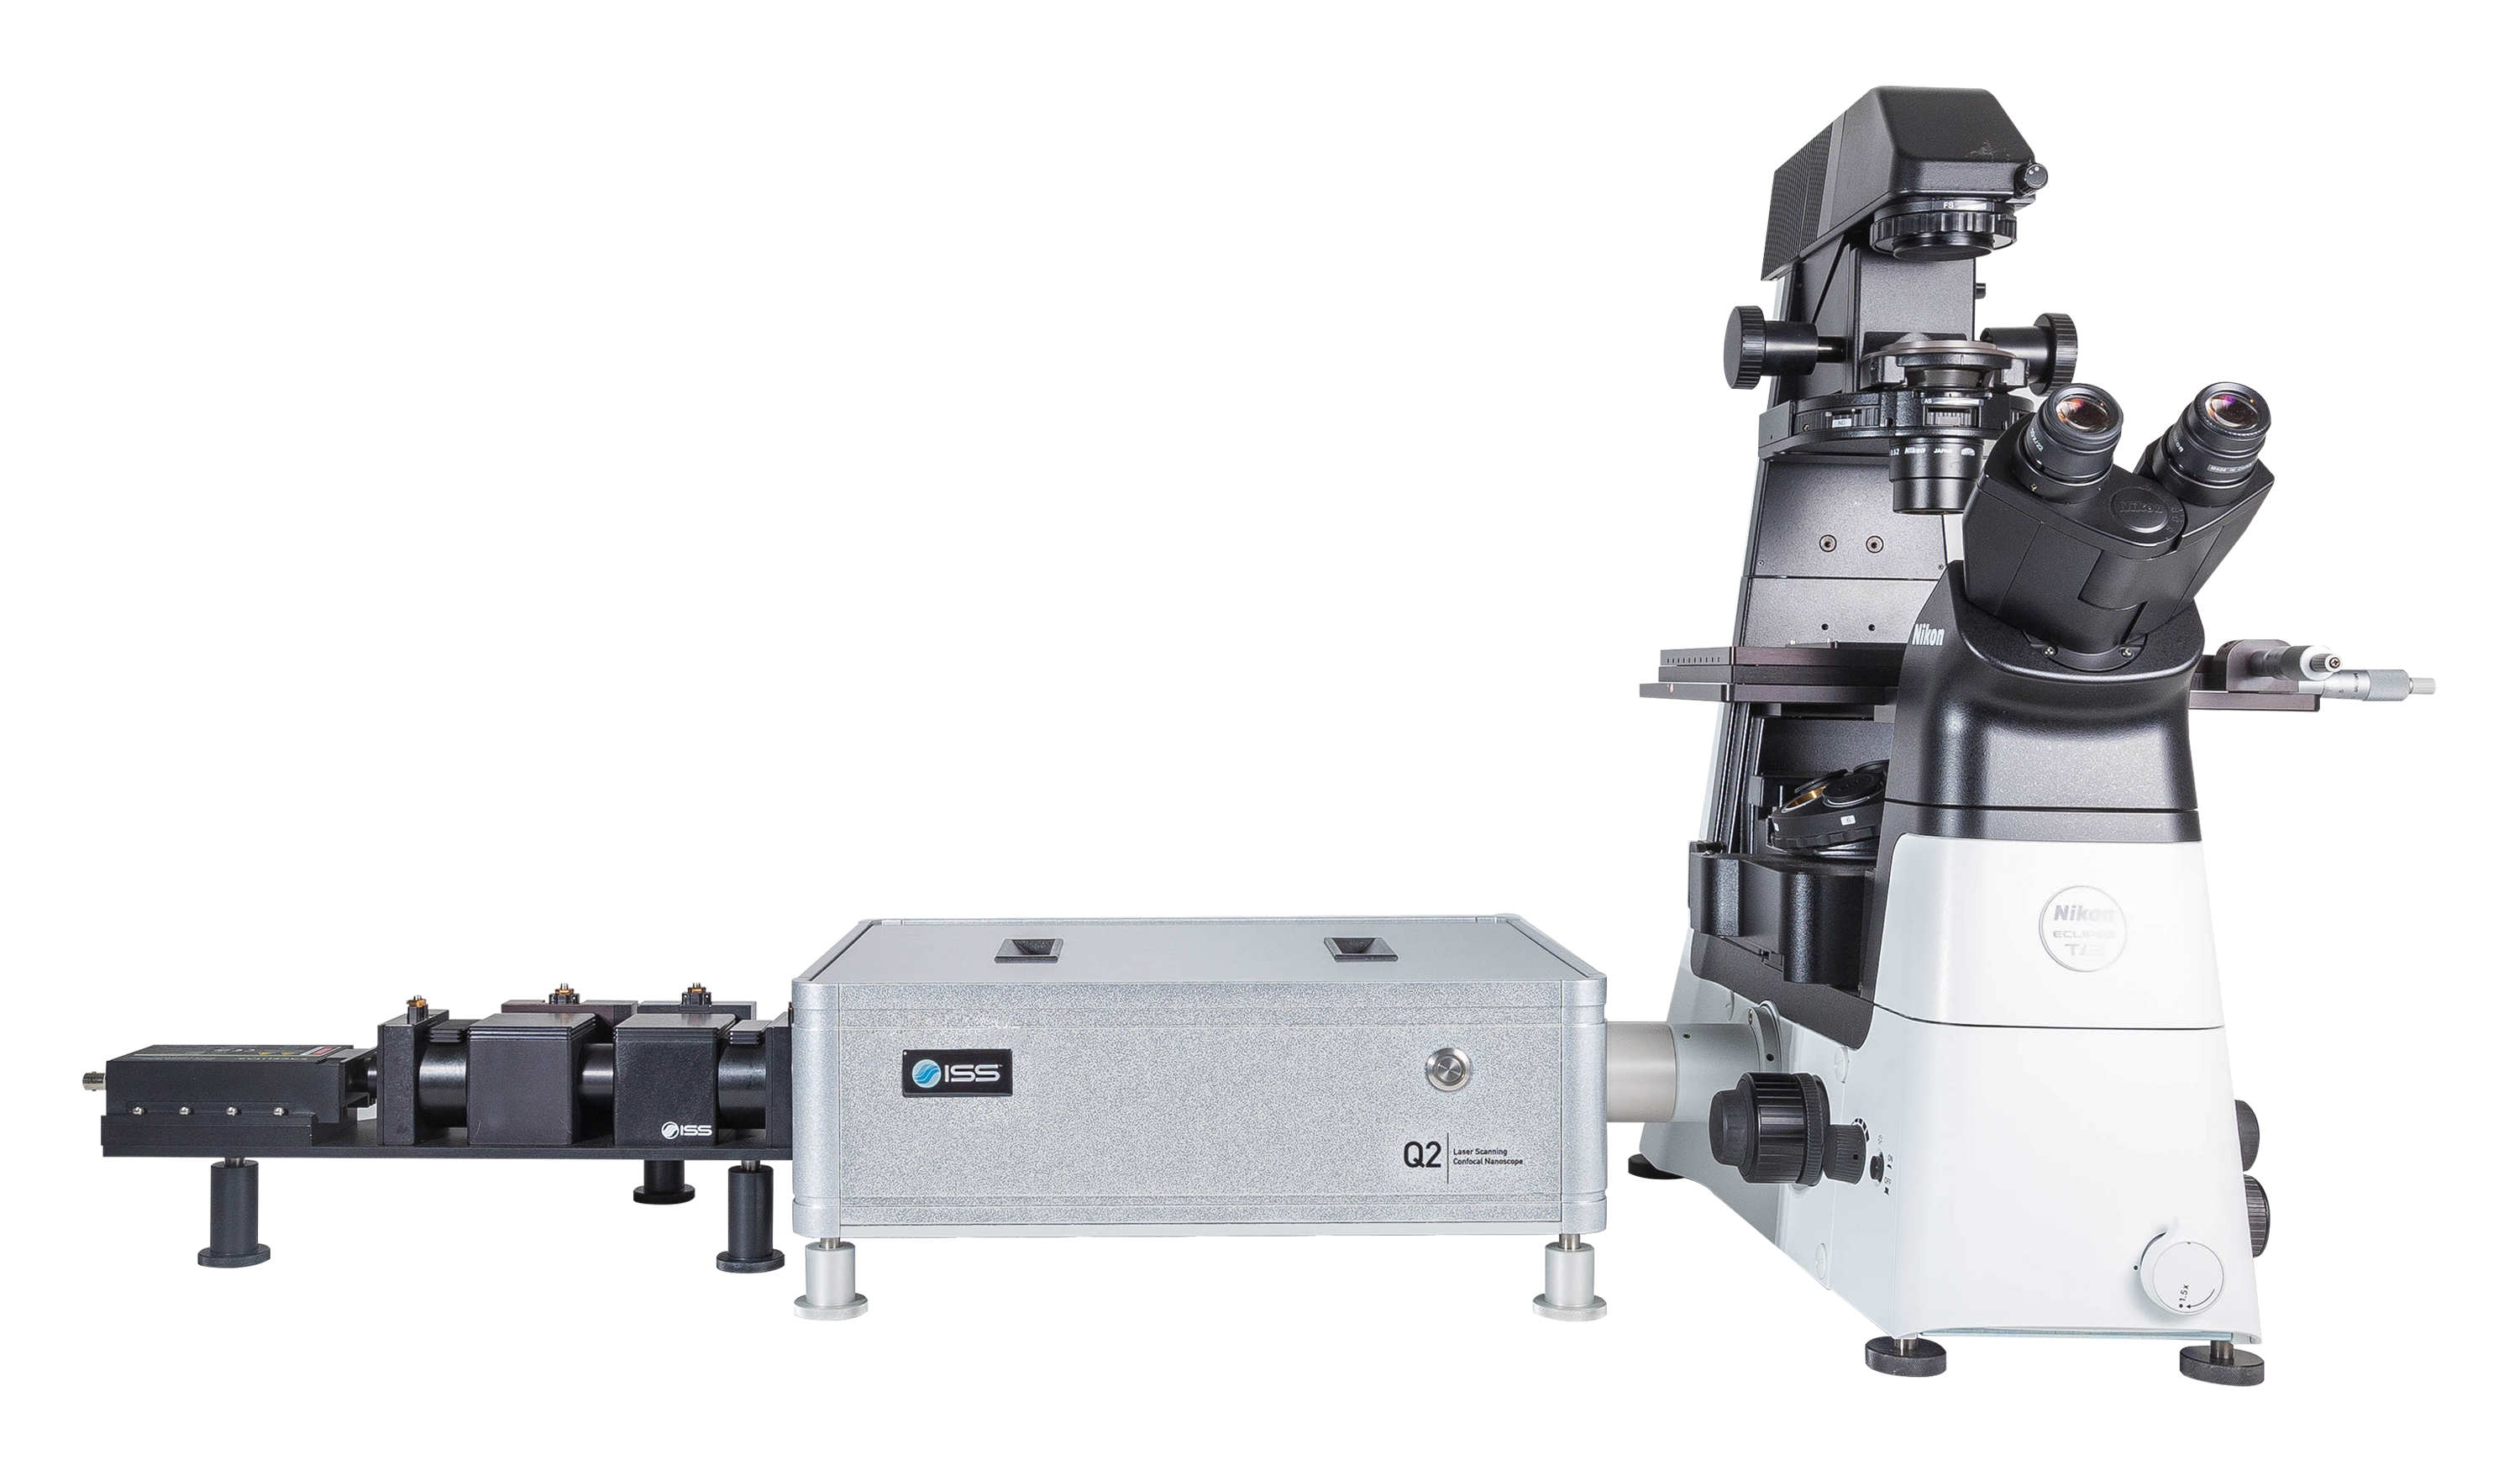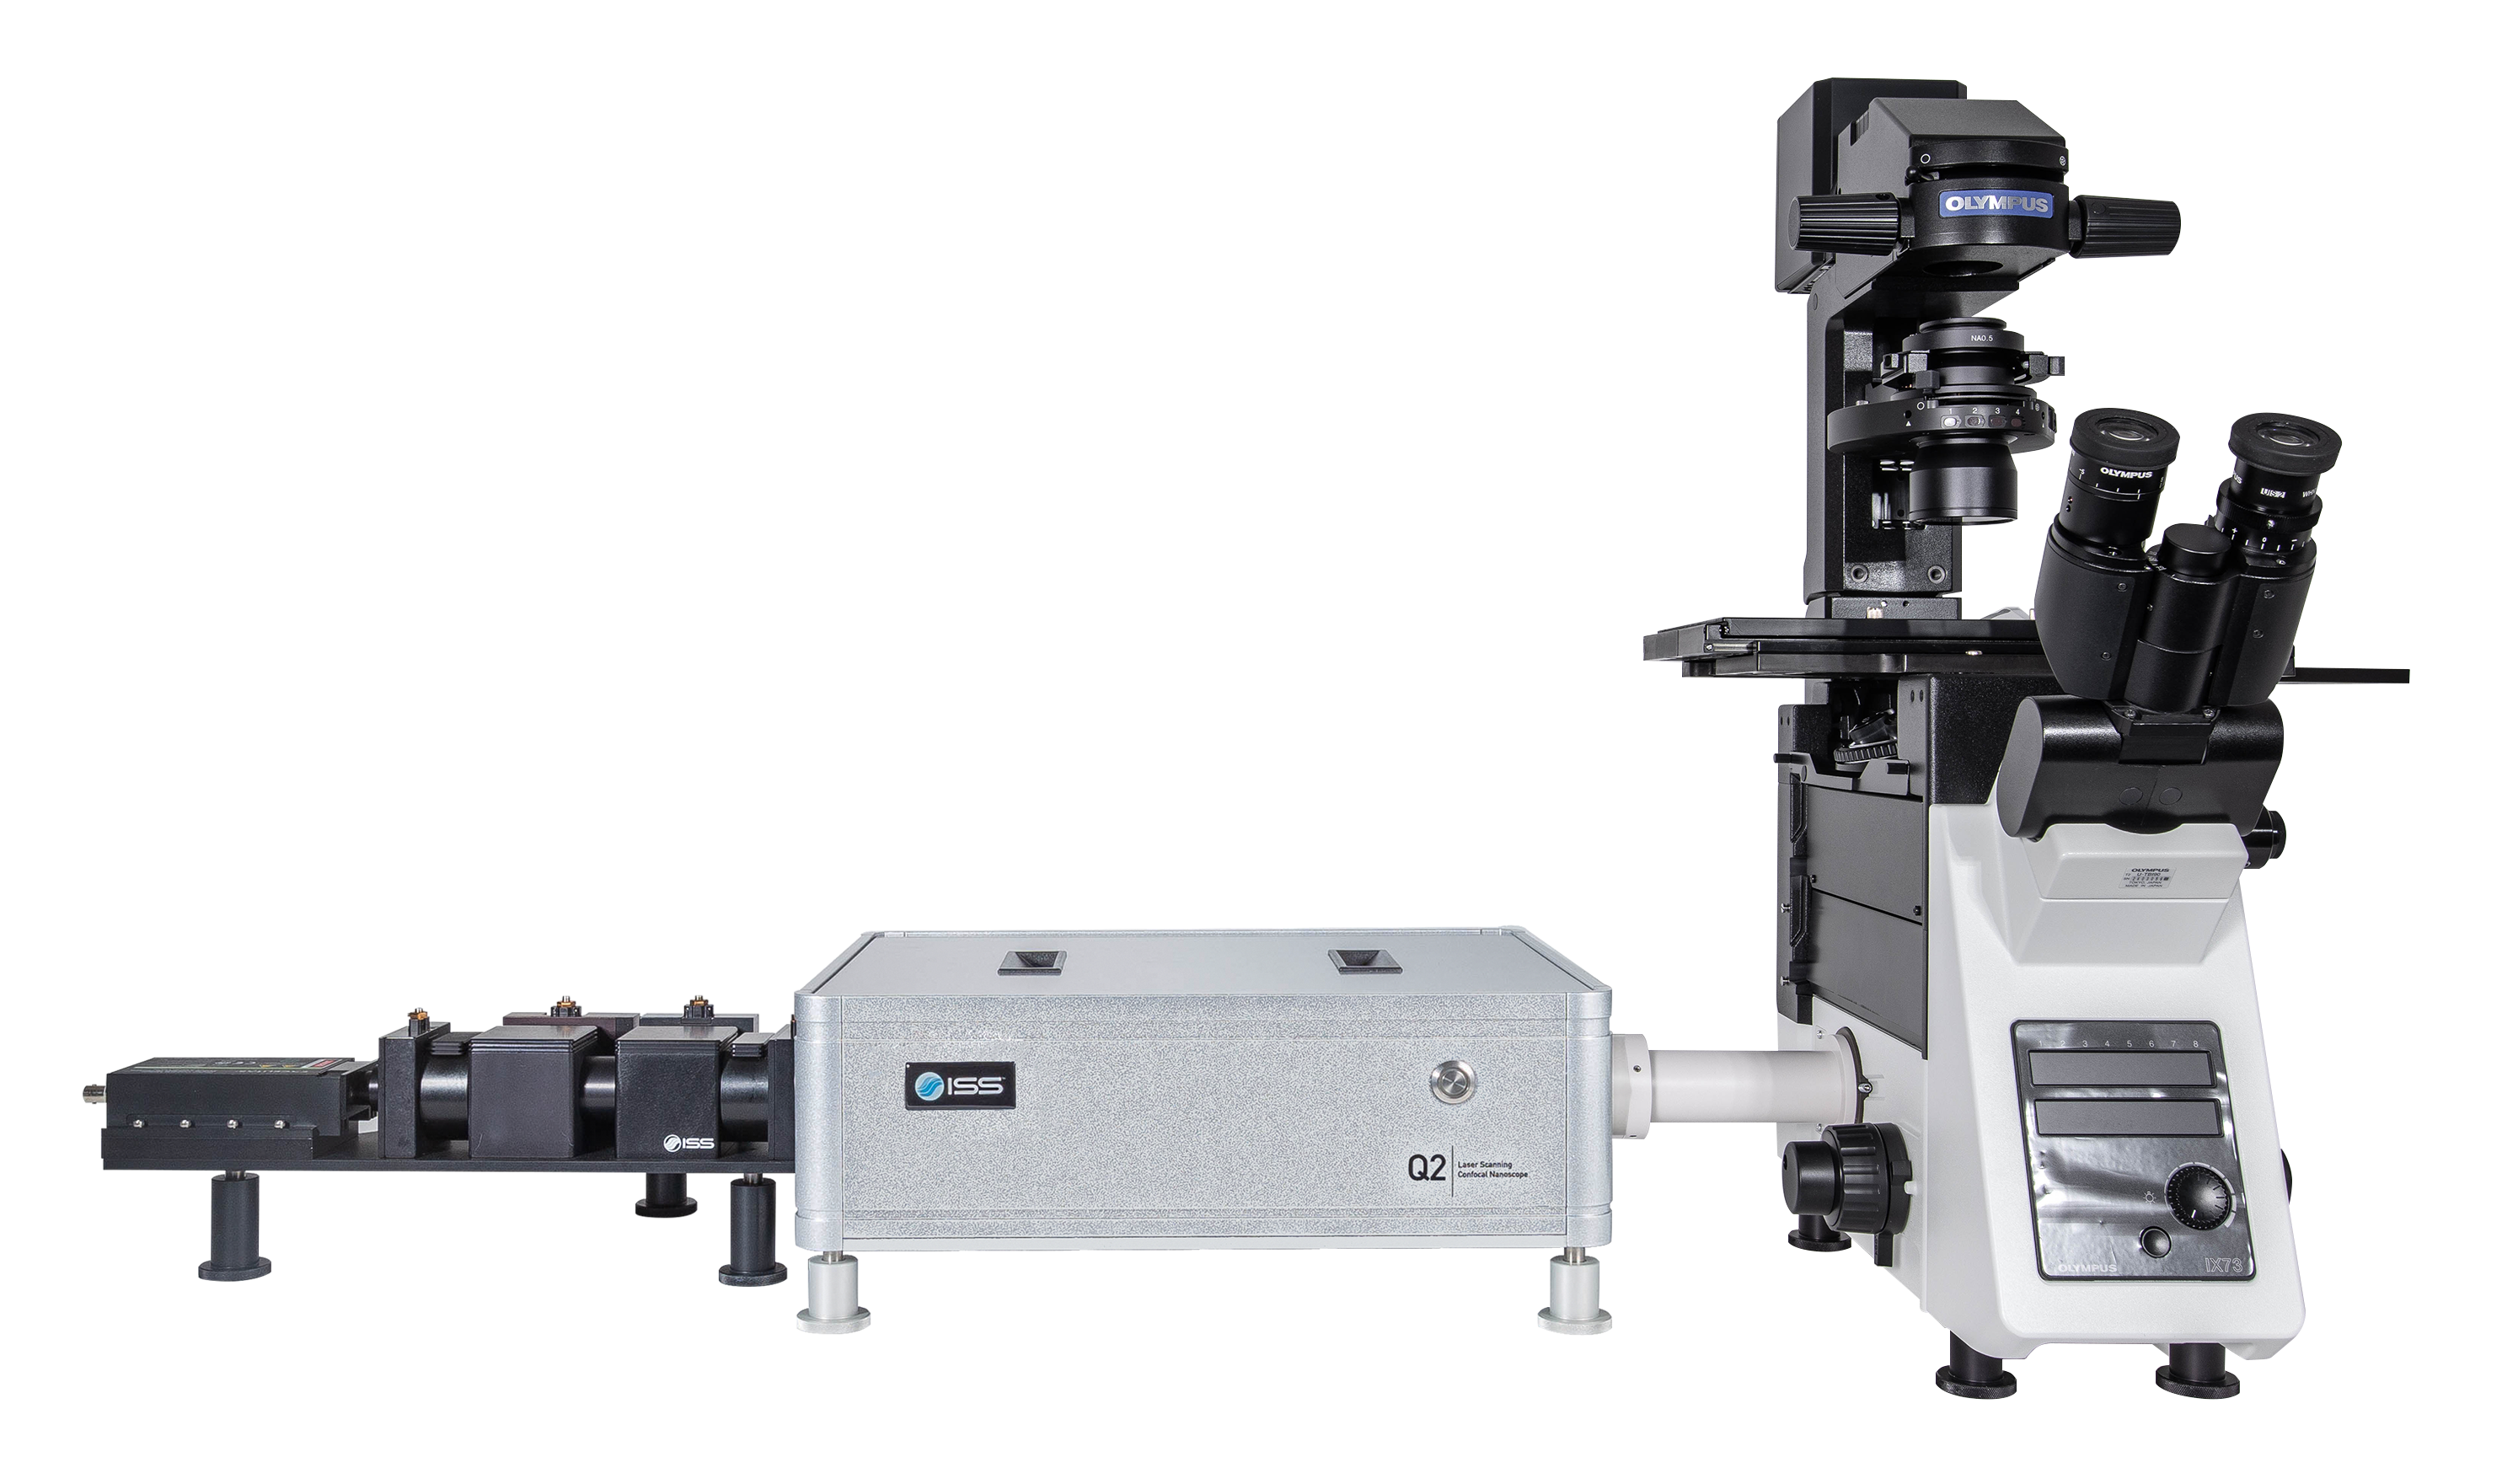
Overview of Q2
A compact and adaptive microscope system for comprehensive time-resolved confocal imaging and FFS measurements, the Q2 can be equipped with single-photon and multi-photon excitation and up to five detection channels to meet the single molecule sensitivity challenges and the fast data acquisition required for live cell imaging and material science applications.
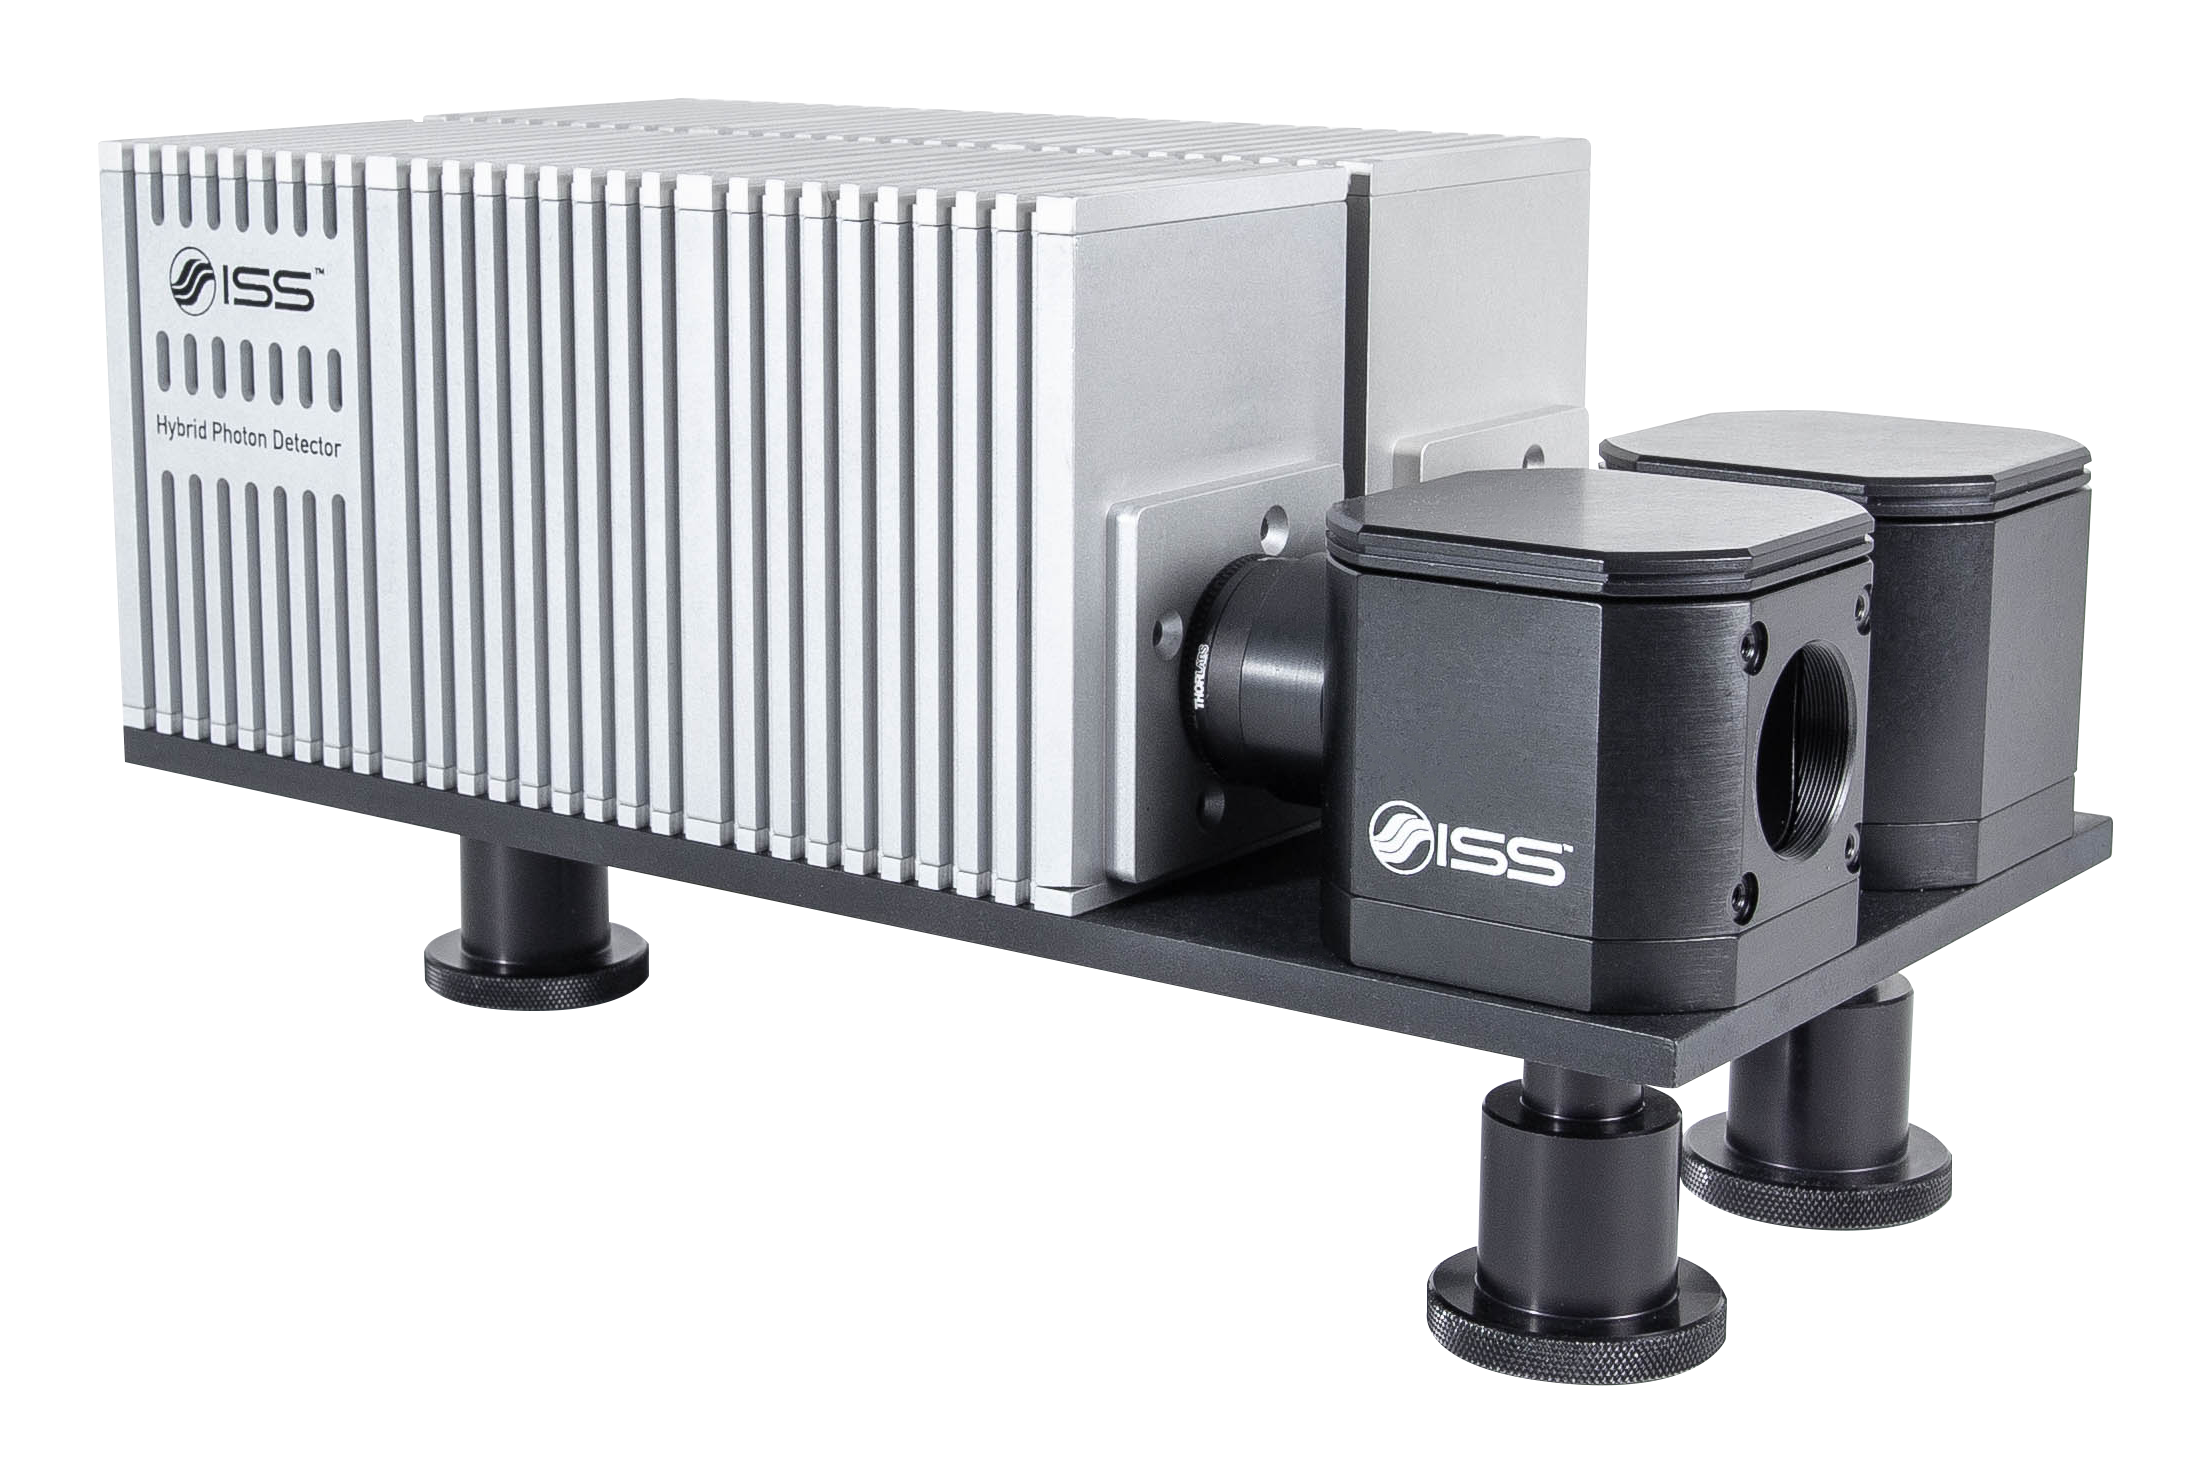
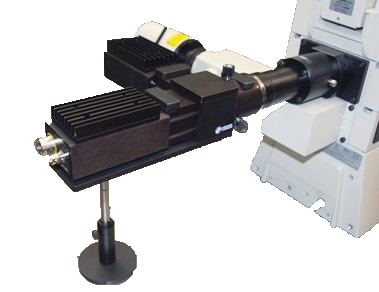
The detectors are conveniently mounted on sturdy baseplates holders that are coupled to the Q2. Cubes holding dichroic filters are located at the channels junctions to separate the wavelength ranges directed to each detector; filters in front of each detector select the spectral wavelength region. The cube accommodates polarizing beam splitters for polarization acquisition.
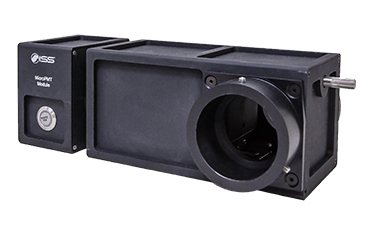
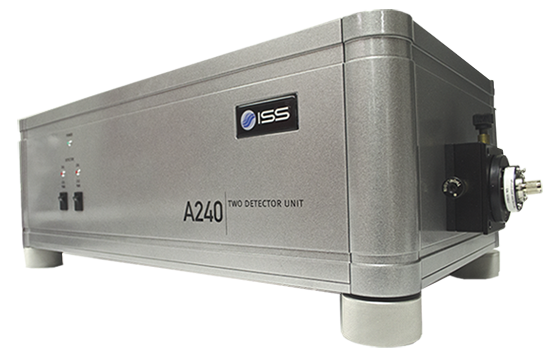
Holder units for two, three and four detectors are available. Detectors type may be different on a holder; for instance, a four-detector unit may carry two SPADs and two hybrid PMTs. A fiber port can replace a detector coupling hardware to connect a spectrograph.
Key Features of Q2

Modularity
A selection of laser wavelengths, detectors, number of detection channels, & microscopes.

Lifetime Measurements
From 100 ps to 100 ms

Affordable Solution
Superb Confocal Images
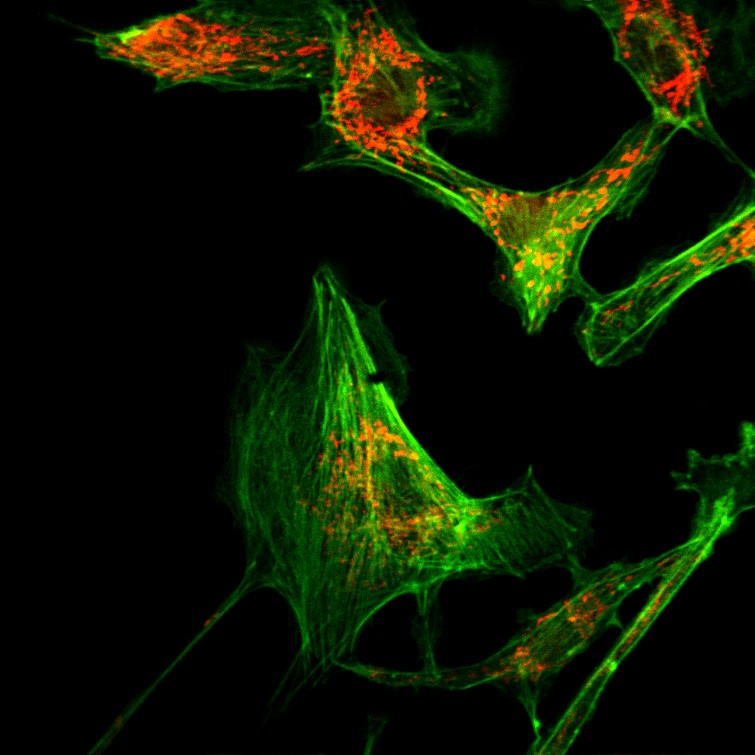
Bovine Pulmonary Artery Endothelial (BPAE) cells stained with Mito-Tracker Red CMXRos and Alexa Fluor 488 Phalloidin
Intensity and Lifetime Imaging
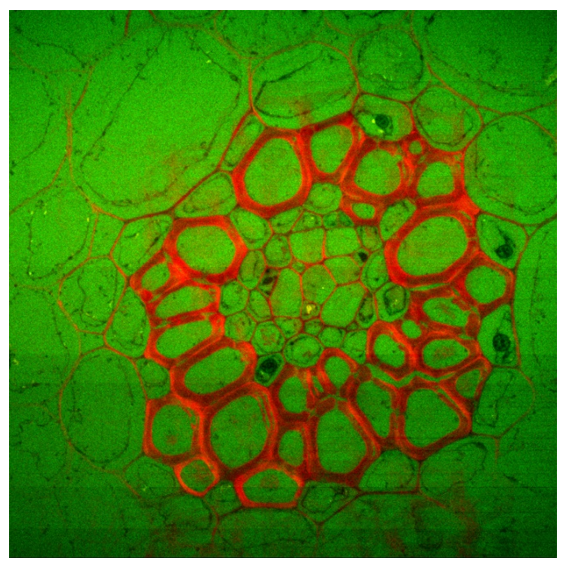
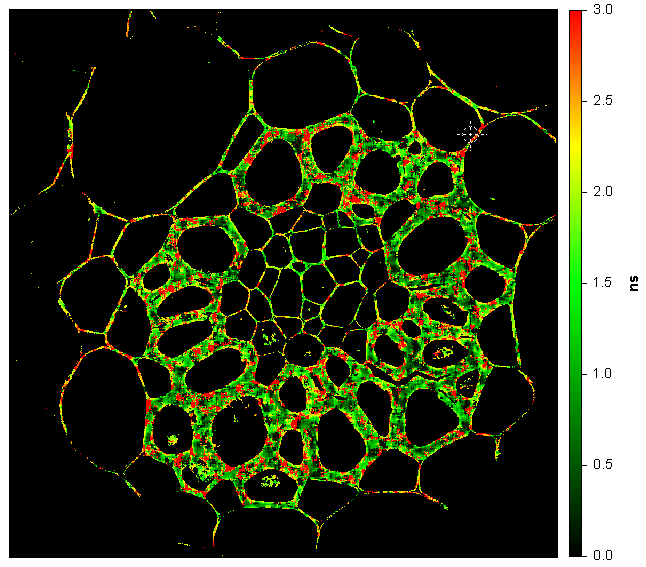
Convallaria (lily of the Valley); Intensity image (first) and lifetime image (last). Image size is 1024 x 1024 pixels (200 µm x 200 µm). Microscope is IX-73 by Olympus using a 60X, NA=1.35 objective. Excitation is 488 nm, emission is collected on CH1 through a 600/37 nm filter, and CH2 through a 525/50 nm filter.
Unmixing the Signal from Autofluorescence in Live Cells Using the Phasor Plot

Acridonylalanine (ACD) is a fluorescent amino acid and its spectra significantly overlap with the endogenous autofluorescent molecule NADH, making imaging of ACD in live cells be likely contaminated by cellular NADH signals. As the lifetime of ACD (about 15 ns) is very different than the lifetime of NADH (< 5 ns), the time-resolved (TR) unmixing procedure is instrumental in producing two separate images for ACD and NADH, respectively.
Single-molecule studies: Detection of Full-Scale FCS
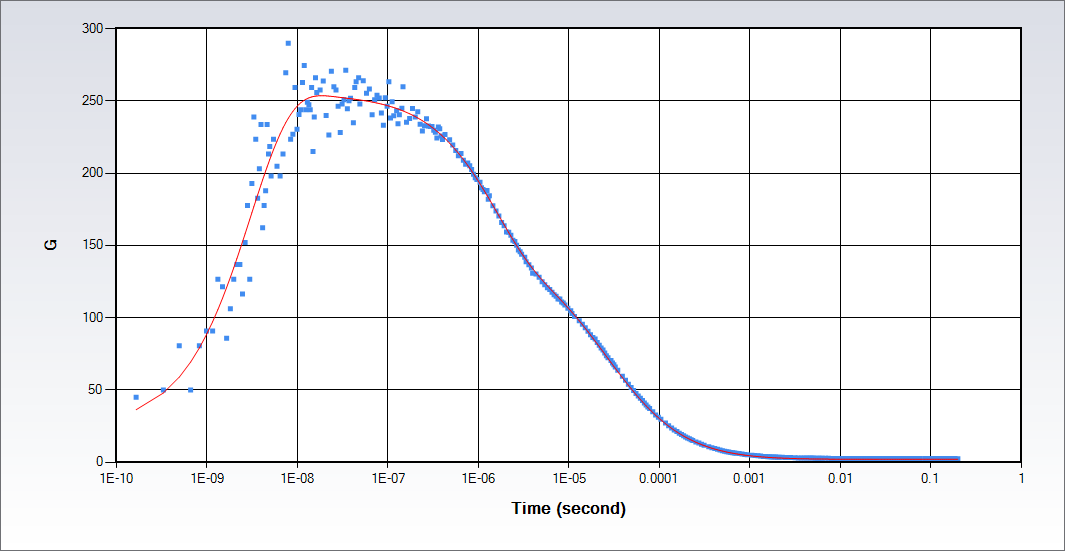
The full time-scale FCS allows for investigation of single molecules photophysical dynamics from picoseconds to seconds. The autocorrelation function determined by FCS provides the translational diffusion of molecules and the chemical or photophysical effects on the molecules, which typically occur in the time scale longer than 1 µs. The extension of the autocorrelation function to the picosecond time scale range provides additional information about the single molecule or nanoparticle: the rotational diffusion times; antibunching. Data in the figure were collected on Rhodamine 110 in water with a continuous wave excitation at 488 nm.
Product Specifications for Q2
Microscope and Coupling
- Evident (Olympus), Nikon, Zeiss and Leica
- Inverted and upright
- Left side port and back port
1p Excitation*
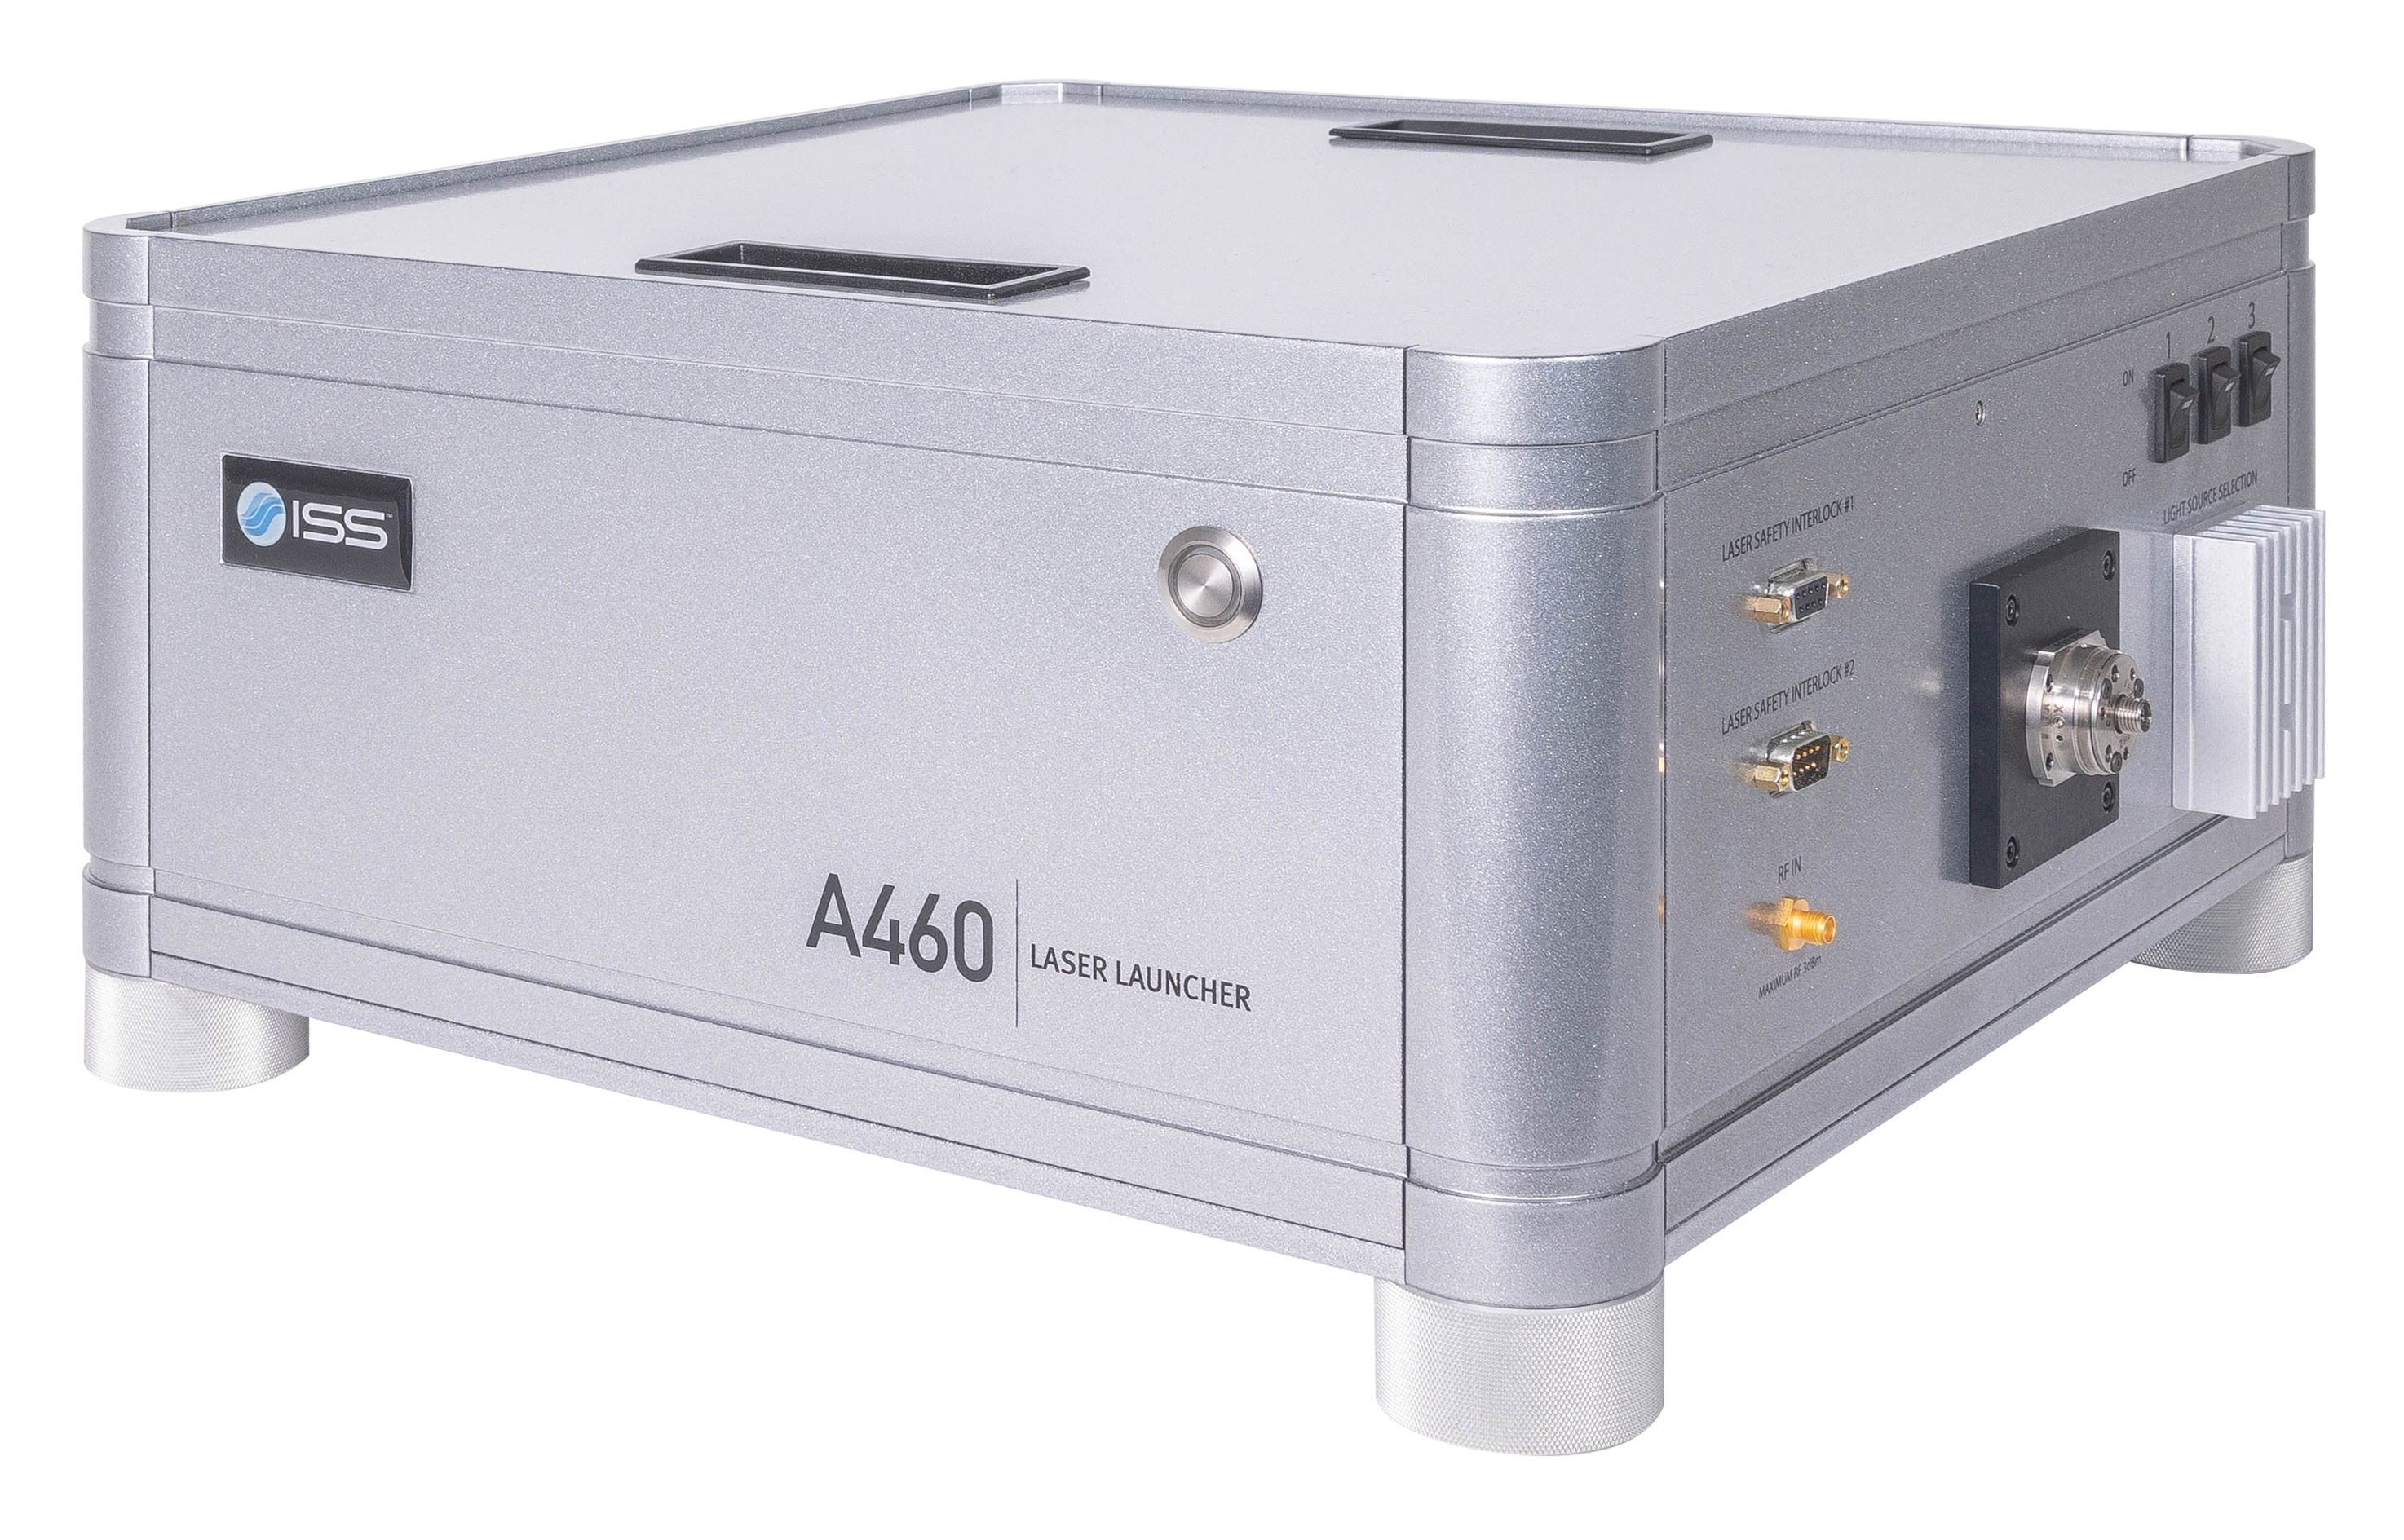
- ISS laser launcher (models for 3-, 4-, and 6-lasers), wavelengths available from 375 nm to 1,000 nm; pulse interleave excitation (PIE)
- Supercontinuum lasers, wavelength from 400 nm to 950 nm
2p Excitation*
- Ultra fast femtosecond pulse Ti:Sapphire lasers
- Ultra fast femtosecond pulse fiber lasers
Galvanometer scanner
- 2 silver-coated galvanometer scanning mirrors
- Clear optical surface: 3 mm or 5 mm
- Maximum scan rate: 5 KHz for 3 mm and 1 KHz for 5 mm
- Scanning resolution: 64 x 64 to 4096 x 4096 pixels
- Scanning mode: Pt, Xt, XZ, XY, XZt, XYt, XYZ
- ROI scanning: rectangle, ellipse, polygon, line
Positioning Controls**
- ISS 3-axis control unit
- ISS XY galvo scanning mirrors control unit
- ISS Z-piezo control unit
- Microscope built-in focusing control module
- Automatic XY stages (ASI, Prior)
- XYZ piezo stages (MadCity, PI)
Pinhole
- Single, variable-aperture pinhole; diameter from 20 µm to 1,000 µm
Detectors
- Cooled GaAsP and GaAs PMT
- Cooled Hybrid PMTs
- SPADs
Data Acquisition Unit
- FastFLIM (Digital Frequency Domain FLIM)
- SWISS TCSPC card (Time Domain FLIM)
Software
- VistaVision
Computer & Monitor
- High-performance Processor, 32 GB RAM
- 32" monitor, 2556 x 1440 resolution
Operating System
- Windows 11, 64-bit
Power Requirements
- Universal power input: 110 - 240 V, 50/60 Hz, 400 VAC
Dimensions (mm)
- 420 (L) x 330 (W) x 150 (H)
Weight (kg)
- 13.5 (without detectors)
Notes
- *Q2 was fully evaluated and validated for using ISS laser launcher, Fianium SC-400 laser and Toptica FemtoFiber Pro 2p laser.
- **VistaVision provides utilities for measurements in spectroscopy mode (at a single point), raster or orbit scan mode (2D XY), optical sectioning mode (3D), time-lapse mode, stage scan mode for multi wells, or a combination of them.
Measurements for Q2
Confocal Intensity and Lifetime Imaging
- 1p or 2p confocal images
- FLIM in frequency-domain or in TCSPC
- Phosphorescence Lifetime Imaging (PLIM)
- Polarization images
Steady-state and Time-resolved Polarization Anisotropy Imaging
Fluorescence Fluctuations Spectroscopy (FFS)
- Fluorescence Correlation Spectroscopy (FCS)
- Fluorescence Cross-Correlation Spectroscopy (FCCS)
- Photon Counting Histogram (PCH)
- Fluorescence Lifetime Correlation Spectroscopy (FLCS)
- Scanning FCS
- Number & Brightness (N&B)
- Raster Imaging Correlation Spectroscopy (RICS)
Particle tracking (optional)
- 3D reconstruction of molecule trajectory
Single Molecule FRET Bursts Analysis
- Burst Analysis
- FRET and Correlation methods
- PIE-FRET methods
Antibunching
Product Accessories for Q2
Additional Product Options
-
Perfusion System
A peristaltic pump supplies the stage with a solution for keeping the sample conditions (temperature, pH, etc...) stable.
-
Irrigation System
When using water objectives for prolonged measurements, it prevents the liquid drying up.
-
Auto Focus Maintaining
It keeps the focus position of the objective for hours using an active feedback to counter drifts.
-
Sample temperature control
Stage top incubator or a full enclosure to maintain the environmental conditions of cell cultures.
-
Epifluorescence Lamp
Visualize your sample with the Epi module. Select as light source either an arc lamp or an LED and the suitable filter cubes to add to the microscope cassette.
-
Atomic Force Microscope (AFM)
Fully integrated for the models:
NanoWizard by JPK-Bruker
Resolve by Bruker
For other models contact ISS.
Product Software for Q2
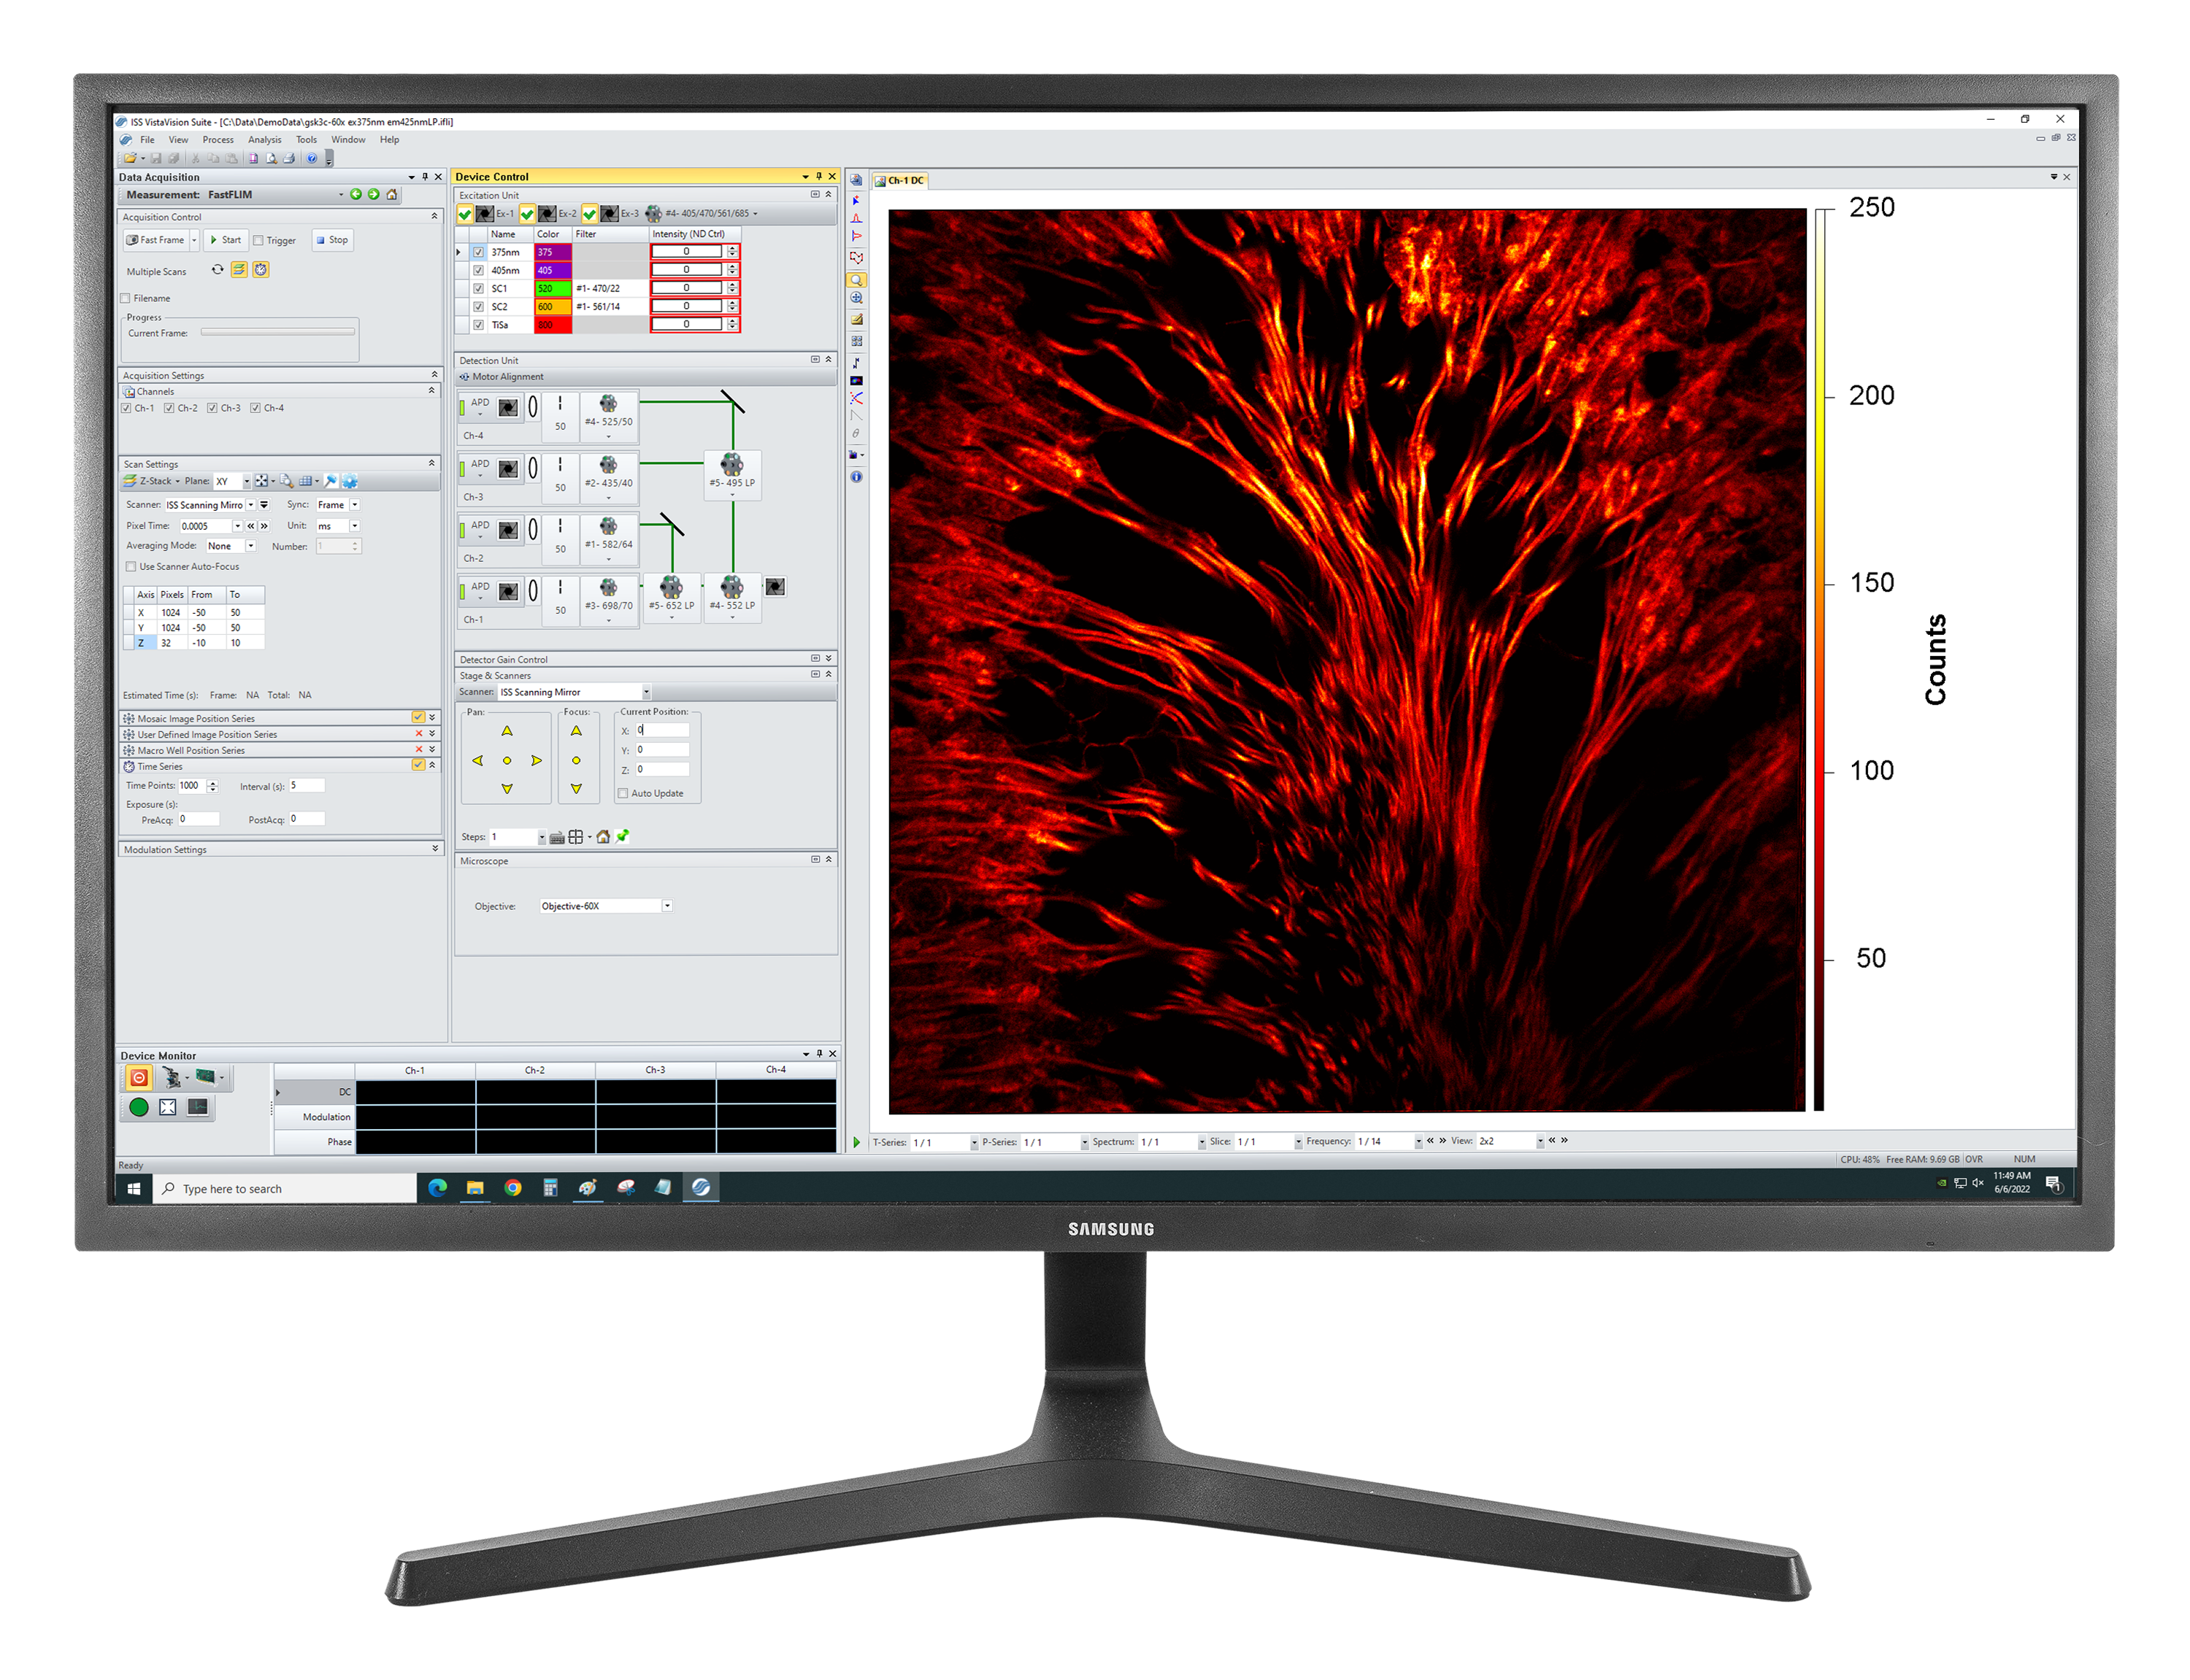
VistaVision
VistaVision is a complete software package for confocal microscopy applications including instrument control, data acquisition and data processing. Easy to use, the software has been developed in modular components that can be activated when a specific instrument configuration is selected. The modules include:
- FLIM/PLIM Imaging
- FFS
- smFRET
- Particle Tracking
Product Resources
-
Correlative confocal fluorescence lifetime and Atomic Force Microscopy imaging by ISS and JPK
-
FLIM Analysis using the Phasor Plots
-
Particle Tracking in a 2-Photon Excitation Microscope
-
The Sweet PIE (Pulsed Interleaved Excitation)
-
Using Alba with the FemtoFiber laser by Toptica for 2-photon quantitative imaging
-
FastFLIM STED for Alba v5
-
“Resolving oligomeric states of photoactivatable proteins in living cells via photon counting histogram analysis.” Camp, T., Li, Z., Li, Y., Oh, T.J., Zhang, K. iScience, 28(11), 2025, Nov. doi: 10.1016/j.isci.2025.113848.
-
“Membrane lipid nanodomains modulate HCN pacemaker channels in nociceptor DRG neurons.” Handlin, L.J., Macchi, N.L., Dumaire, N.L.A., Salih, L., Lessie, E.N., McCommis, K.S., Moutal, A. & Dai, G. Nature Communications, 15(1), 2024, Nov. doi: 10.1038/s41467-024-54053-z.
-
“Voltage sensor conformations induced by LQTS-associated mutations in hERG potassium channels.” Chan, A.N., Quach, C.D, Handlin, L.J., Lessie, E.N., Tajkhorshid, E., & Dai, G. Nature Communications, 16(1), 2025, Aug. doi: 10.1038/s41467-025-62472-9.
-
“Rapid and specific detection of nanoparticles and viruses one at a time using microfluidic laminar flow and confocal fluorescence microscopy.” Drori, P., Mouhadeb, O., Moya M.G.G., Razvag, Y., Alcalay, R., Klocke, P., Cordes, T., Zahavy, E. & Lerner, E. iScience, 27(10), p. 110982, 2024, Oct. doi: 10.1016/j.isci.2024.110982.
-
“Discordant Antigenic Properties of Soluble and Virion SARS-CoV-2 Spike Proteins.” Sameer, K., Souradip, D., M., S.M., A., S.G., L., D.A. & Krishanu, R. Viruses, 16(3), p. 407, 2024, Mar.
-
“Unravelling Immune‐Inflammatory Responses and Lysosomal Adaptation: Insights from Two‐Photon Excited Delayed Fluorescence Imaging.” Xiang, W., Gaona, S., Shengnan, X., Yuansheng, S., Hailin, Q., Qinghua, W., Xiaowan, H., Qingyang, Z., Tiantai, Z. & Hai‐Yu, H. Advanced Healthcare Materials, 2024, Mar.
-
“Direct regulation of the voltage sensor of HCN channels by membrane lipid compartmentalization.” Handlin, L.J. & Dai, G. Nature Communications, 14(1), 2023, Oct. doi: 10.1038/s41467-023-42363-7.
-
“Fluorescent protein lifetimes report densities and phases of nuclear condensates during embryonic stem-cell differentiation.” Joron, K., Viegas, J.O., Haas-Neill, L., Bier, S., Drori, P., Dvir, S., Lim, P.S.L., Rauscher, S., Meshorer, E. & Lerner, E. Nature Communications, 14(1), 2023, Aug. doi: 10.1038/s41467-023-40647-6.
-
“Plasmonic Nanodiamonds.” Liang, L., Zheng, P., Jia, S., Ray, K., Chen, Y. & Barman, I. Nano Letters, 23(12), pp. 5746–5754, 2023, Jun. doi: 10.1021/acs.nanolett.3c01514.
-
“Bioorthogonal Lanthanide Molecular Probes for Near-Infrared Fluorescence and Mass Spectrometry Imaging.” Jin, G.-Q., Sun, D.-e., Xia, X., Jiang, Z.-F., Cheng, B., Ning, Y., Wang, F., Zhao, Y., Chen, X. & Zhang, J.-L. Angewandte Chemie International Edition, 61(43), 2022, Sep. doi: 10.1002/anie.202208707.
-
“The structural heterogeneity of α-synuclein is governed by several distinct subpopulations with interconversion times slower than milliseconds.” Chen, J., Zaer, S., Drori, P., Zamel, J., Joron, K., Kalisman, N., Lerner, E. & Dokholyan, N.V. Structure, 29(9), pp. 1048–1064.e6, 2021, Sep. doi: 10.1016/j.str.2021.05.002.
-
“Multiplexed patterning of hybrid lipid membrane and protein arrays for cell signaling study.” Ti, Y.-T., Cheng, H.-C., Li, Y. & Tu, H.-L. Lab on a Chip, 21(14), pp. 2711–2720, 2021, Sep. doi: 10.1039/d1lc00178g.
-
“The structural heterogeneity of α-synuclein is governed by several distinct subpopulations with interconversion times slower than milliseconds.” Chen, J., Zaer, S., Drori, P., Zamel, J., Joron, K., Kalisman, N., Lerner, E. & Dokholyan, N.V. Structure, 29(9), pp. 1048–1064.e6, 2021, Sep. doi: 10.1016/j.str.2021.05.002.
-
“Low-Dimensional Organic Metal Halide Hybrids with Excitation-Dependent Optical Waveguides from Visible to Near-Infrared Emission.” Wu, S., Zhou, B. & Yan, D. ACS Applied Materials & Interfaces, 13(22), pp. 26451–26460, 2021, May. doi: 10.1021/acsami.1c03926.
-
“Genetic encoding of a highly photostable, long lifetime fluorescent amino acid for imaging in mammalian cells.” Jones, C.M., Robkis, D.M., Blizzard, R.J., Munari, M., Venkatesh, Y., Mihaila, T.S., Eddins, A.J., Mehl, R.A., Zagotta, W.N., Gordon, S.E. & Petersson, E.J. Chemical Science, 12(36), pp. 11955–11964, 2021, Feb. doi: 10.1039/d1sc01914g.
-
“Near-Unity Cyan-Green Emitting Lead-Free All-Inorganic Cesium Copper Chloride Phosphors for Full-Spectrum White Light-Emitting Diodes.” Bai, W., Shi, S., Lin, T., Zhou, T., Xuan, T. & Xie, R.-J. Advanced Photonics Research, 2(3), p. 2000158, 2021, Feb. doi: 10.1002/adpr.202000158.
-
“Rationally designed organelle-specific thermally activated delayed fluorescence small molecule organic probes for time-resolved biological applications.” Zhang, Q., Xu, S., Li, M., Wang, Y., Zhang, N., Guan, Y., Chen, M., Chen, C.-F. & Hu, H.-Y. Chemical Communications, 55(39), pp. 5639–5642, 2019. doi: 10.1039/c9cc00898e.
-
“Nanoscopic Insights of Amphiphilic Peptide against the Oligomer Assembly Process to Treat Huntington's Disease.” He, R.-Y., Lai, X.-M., Sun, C.-S., Kung, T.-S., Hong, J.-Y., Jheng, Y.-S., Liao, W.-N., Chen, J.-K., Liao, Y.-F., Tu, P.-H. & Huang, J.J.-T. Advanced Science, 7(2), p. 1901165, 2019, Dec. doi: 10.1002/advs.201901165.
-
“High Efficiency (16.37%) of Cesium Bromide—Passivated All-Inorganic CsPbI2Br Perovskite Solar Cells.” Zhang, Y., Wu, C., Wang, D., Zhang, Z., Qi, X., Zhu, N., Liu, G., Li, X., Hu, H., Chen, Z., Xiao, L. & Qu, B. Solar RRL, 3(11), p. 1900254, 2019, Aug. doi: 10.1002/solr.201900254.
-
“Concurrent Exposure of Neutralizing and Non-neutralizing Epitopes on a Single HIV-1 Envelope Structure.” Ray, K., Mengistu, M., Orlandi, C., Pazgier, M., Lewis, G.K. & Devico, A.L. Frontiers in Immunology, 10(2), p. 1901165, 2019, Jul. doi: 10.3389/fimmu.2019.01512.
-
“FAPbI3 Flexible Solar Cells with a Record Efficiency of 19.38% Fabricated in Air via Ligand and Additive Synergetic Process.” Wu, C., Wang, D., Zhang, Y., Gu, F., Liu, G., Zhu, N., Luo, W., Han, D., Guo, X., Qu, B., Wang, S., Bian, Z., Chen, Z. & Xiao, L. Advanced Functional Materials, 29(34), p. 1902974, 2019, Jun. doi: 10.1002/adfm.201902974.
-
“Highly luminescent, biocompatible ytterbium(
iii ) complexes as near-infrared fluorophores for living cell imaging.” Ning, Y., Tang, J., Liu, Y.-W., Jing, J., Sun, Y. & Zhang, J.-L. Chemical Science, 9(15), pp. 3742–3753, 2018. doi: 10.1039/c8sc00259b. -
“Band-Aligned Polymeric Hole Transport Materials for Extremely Low Energy Loss α-CsPbI3 Perovskite Nanocrystal Solar Cells.” Yuan, J., Ling, X., Yang, D., Li, F., Zhou, S., Shi, J., Qian, Y., Hu, J., Sun, Y., Yang, Y., Gao, X., Duhm, S., Zhang, Q. & Ma, W. Joule, 2(11), pp. 2450–2463, 2018, Nov. doi: 10.1016/j.joule.2018.08.011.
-
“Composition-Graded Cesium Lead Halide Perovskite Nanowires with Tunable Dual-Color Lasing Performance.” Huang, L., Gao, Q., Sun, L.-D., Dong, H., Shi, S., Cai, T., Liao, Q. & Yan, C.-H. Advanced Materials, 30(27), p. 1800596, 2018, May. doi: 10.1002/adma.201800596.
-
“Targeting the Late Stage of HIV-1 Entry for Antibody-Dependent Cellular Cytotoxicity: Structural Basis for Env Epitopes in the C11 Region.” Tolbert, W.D., Gohain, N., Alsahafi, N., Van, V., Orlandi, C., Ding, S., Martin, L., Finzi, A., Lewis, G.K., Ray, K. & Pazgier, M. Structure, 25(11), pp. 1719–1731.e4, 2017, Nov. doi: 10.1016/j.str.2017.09.009.
-
“Molecular basis for epitope recognition by non-neutralizing anti-gp41 antibody F240.” Gohain, N., Tolbert, W.D., Orlandi, C., Richard, J., Ding, S., Chen, X., Bonsor, D.A., Sundberg, E.J., Lu, W., Ray, K., Finzi, A., Lewis, G.K. & Pazgier, M. Scientific Reports, 6(1), pp. 1719–1731.e4, 2016, Nov. doi: 10.1038/srep36685.
Configurations of Q2


One Detector


Two Detectors on Q2
The beam is separated by a dichroic mounted onto a cube inserted in the T-junction. Filters can be added to the cube or to the filters holders in front of each detector.SPAD detectors are coupled to an XZ stage for fine alignment, as well as the entire assembly.


Two Detectors and a Spectrograph on Q2
The beam is separated by a dichroic mounted onto a cube inserted in the T-junction. Filters can be added to the cube or to the filters holders in front of each detector.SPAD detectors are coupled to an XZ stage for fine alignment, as well as the entire assembly.


Two Detectors Aligned in Parallel on Q2
The beam is separated by a dichroic mounted onto a cube inserted in the T-junction. Filters can be added to the cube or to the filters holders in front of each detector.SPAD detectors are coupled to an XZ stage for fine alignment, as well as the entire assembly.


Two Detectors Aligned in Parallel and a Spectrograph on Q2
The beam is separated by a dichroic mounted onto a cube inserted in the T-junction. Filters can be added to the cube or to the filters holders in front of each detector.SPAD detectors are coupled to an XZ stage for fine alignment, as well as the entire assembly.


Three Detectors on Q2
Each detector is coupled to a XZ stage for fine alignment.

